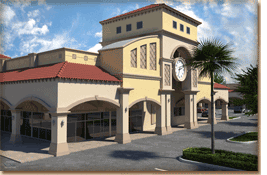
 Royal University Plaza is currently located in the heart of the City of Coral Springs. It contains approximately 1,000 feet frontage on University Dr., where the average daily traffic count is 43,000 vehicles. Over 400 feet of the shopping center is facing Royal Palm Blvd., where the average traffic count is 27,500 vehicles per day. This location is considered to be Coral Springs finest and most sought after corner by far. Royal University Plaza is 89,000 square feet of rentable retail area. The shopping center is accessible from North, South, East, and West entrances, which makes traffic flow extremely easy and without any obstructions. Parking is plentiful, with over 690 spaces available for easy access to all of the businesses.
Tentants' base is strong with different specialty stores. Some of the tenants have been at this location anywhere from 2 years to over 20 years. Royal University Plaza is the retailer's choice in Northwest Broward County.

Coral Springs is a city located in the northwest section of Broward County. It has been incorporated since July 1963. The city is easily accessible from all major throughways, including: Florida Turnpike, Interstate 95, State Road 7 (441), and the Sawgrass Expressway. Currently, there are approximately 129,766 people residing in the city with a median age of 35 years and a median household income of $74,232. Coral Springs has become the premier South Florida community. It is known for its quality schools, athletic programs and attractive neighborhoods. The city has achieved national recognition by Money Magazine as the best place to live. America's Promise in 2006 and 2007 called the city one of the 100 best communities for young people.
Coral Springs: At A Glance
Incorporated July 10, 1963
Commission - City Manager Form of Government
Five-member City Commission, nonpartisan, elected at large
City Manager appointed by the City Commission
| DEMOGRAPHICS
Population
(As of April 1st of each year from Bureau of Economic and Business Research-BEBR-Year 2000 is U.S.
Census Bureau)
1980
1990
1993
1994
1995
1996
1997
1998
1999
|
37,349
78,864
88,944
90,586
93,439
98,553
102,916
107,156
111,724
|
|
2000
2001
2002
2003
2004
2005
2006 (Est.)
2007 (Est.)
2008 (Proj.)
|
117,549
120,085
122,687
124,000
126,711
126,852
129,615
129,766
130,000
|
Median Age
Number of Households (COs thru 7/1/2006)
Single Famile/Duplex
Multi-Family
Median Household Income (ESRI-2006)
Racial Composition
One race
White
Black or African American
American Indian, Alaskan Native
Asian
Native Hawaiian & Other Pacific Islander
Some other race
Two or more races
Hispanic or Latino (of any race)
|
36.2
45,493
23,979
21,514
$74,232
97.3%
75.6%
12.7%
0.2%
4.4%
0.2%
4.2%
2.7%
24.5%
|
Source: 2006 US Bureau of the Census, American Comunity Survey and 2007 Certificate of Occupancy data.
POLICE
Police Officers
Number of service calls
Number of 911 calls
Average emergency response time
|
202
170,000
72,000
5:31 min.
|
FIRE/EMS
Uniform Strength:
Career and Certified Firefighters
Number of fire stations
Number of service calls:
Fire
EMS
Average Response Time:
Fire*
EMS*
*method of time calculation has been changed.
|
157
6
4,500
10,171
5:58 min.
5:37 min. |
PUBLIC WORKS
Tons of waste recycled
Streets/ miles maintained
City vehicles & equipment maintained
Bike path/ sidewalks
|
5,540 tons
222 miles
1,252
90 miles
|
|
LAND USE
|
Land Area
Land Use:
Residential
Traffic Circulation
Commercial
Recreation/ Open Source
Waterways
Community Facilities/ Schools/ Hospitals
Industrial
Downtown LAC
Developed
Underdeveloped
|
23.93 sq. miles
% of Total
54.0%
13.0%
7.0%
8.0%
8.0%
7.0%
2.0%
1.0%
100.0%
99.0%
1.0%
100.0%
|
Source: 2007 Community Development Land Data Record System and GIS.
ECONOMICS
Office Space
Retail Space
Industrial Space
Assessed Tax Property Valuation
(2007 Tax Year)
Property Tax Mileage Rate (FY 2008):
General Operating
Voter-Approved Debt
Total
Bond Ratings:
Moody's Investors Services
Standard and Poors
Fitch Rating Services
Per Capita Debt (FY 2006):
General Obligation Debt Per Capita
Fiscal Year 2008 Net Adopted Budget
|
2.6 million sq. ft.
5.7 million sq. ft.
3.0 million sq. ft.
$10,392,005.199
$3.3651
$0.17774
$3.5425
Aaa
AAA
AAA
$95.40
$137,370,262 |
UTILITY DISTRICT
Size
Population served
Miles of water lines
Fire Hydrants
NUmber of wells
Average daily water demand
Daily water treatment capacity
Sewer lines/ force mains
Average daily sewer treatment
Sewer reserve capacity
|
11.5 sq. miles
61,490
12,788
157
1,500
19
6.91 M gals.
16 M gals.
122/31 miles
7.56 M gals.
9.79 M gals.
|
TOTAL CITY STAFF
Full Time (excludes City of Parkland Fire Staff)
Part Time
Subtotal
Temporary (excludes Summer Recreation)
Total |
771
3
774
213
987
|
|
|


